Whether you love it or hate it, working from home (or WFH) has become a normal part of our professional lives. While we are starting to see the impact of the WFH revolution play out in our data, it is still very early days in quantifying the long-term impact on the retail market (and we know there will be one) of this seismic change to working culture. However, there are already some clear impacts to corners of the market that we can report on today.
The dive in footfall
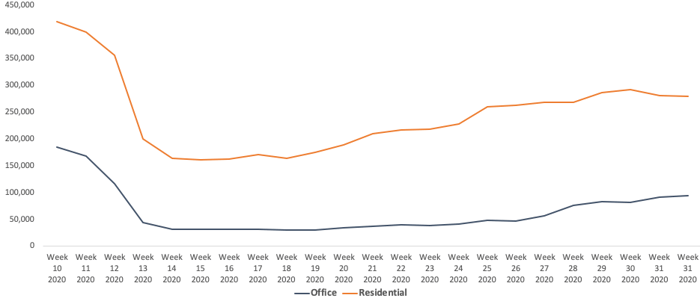
A sample of Local Data Company footfall sensors reveals the significant variance between footfall in residential areas and office areas from (pre-lockdown) week 6 2020 (Feb 3rd) to week 32 (Aug 3rd). What is clear in the figure below is the widening of the gap between office-based (see the grey line in Figure 1) and residential (orange) town profiles from week 13 onwards which was when lockdown was introduced in the UK. This gap started to close in week 31 as more offices reopened and staff were encouraged to get back to work to help boost the economy. It will be critical to keep a close eye on footfall trends over the next few weeks and months as advice changes and develops in line with a rapidly changing pandemic
footfall trends across office and residential locations
 Figure 1: footfall trends for office and residential locations
High street by size
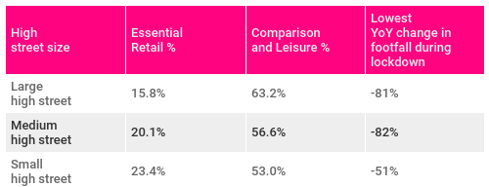
To demonstrate the differences in retail mix between office and residential areas, we can separate high streets by their size; small, medium and large to measure differences between bigger (typically city centres and large towns with huge volumes of office space) and smaller towns which are more commuter and residential-focused. During lockdown, we were measuring the resilience of locations by calculating the percentage of units classified as ‘essential’ – i.e those stores which were able to stay open and subsequently are more likely to survive. This analysis can be used alongside other factors such as the percentage of comparison and leisure units, which are more likely to experience intense challenges with social distancing, introduction of curfews and pressure from online as we work through the pandemic. Together, these factors provide an understanding of the risk levels of these different types of locations.

Figure 2: Key risk factors for small, medium and large towns. (Source: Local Data Company)
Figure 2 clearly shows how the larger the town, the lower percentage of essential retail, higher percentage of ‘at risk’ categories and the bigger dip in footfall experienced through lockdown.
Recent LDC analysis produced for the Guardian visuals team showed the variance of reopening rates back in August. Taking Greater Manchester as an example, we compared the reopening rate of commuter town Sale, in which 88% of stores had reopened, compared to city centre district Spinningfields which mainly caters for a local office population with restaurants, bars and health and beauty units, which had just 58% of stores open. A stark difference between the office-focused and residential areas.
grabbing a bite
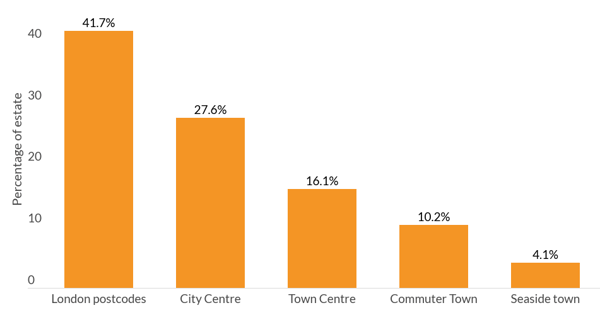
One category which has been significantly impacted by the change in working culture is the food to go sector. Figure 3 shows the town profile split for the top 20 food to go brands across GB by size. Food to go includes brands which sell food not generally for consumption on site such as Tossed, Pret A Manger, Subway and Coco Di Mama and differs slightly to the fast food takeaway category which includes the fast food operators such as McDonalds and KFC.
town profile split for entire estate of top 20 food to go brands
 Figure 3 – Town profile split for top 20 food to go brands by size. (Source: Local Data Company)
Data shows that these brands are heavily exposed to changing work habits, with just under 42% of all units in London postcodes, many of which cluster around areas with previously busy office populations. Combining city centre and London postcodes, almost 70% of units are located in these office-focused locations as opposed to the smaller and more residential towns. Over the coming months these brands will be taking a long, hard look at their location strategies, which have served them well until very recently and will be wondering, what next?
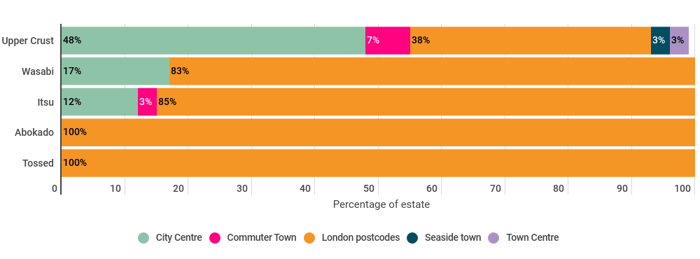
Many of these brands have already taken steps towards a strategy overhaul, with a handful announcing a CVA. Of the top 20 used for this analysis, five have taken this path, and it’s striking to see how heavily concentrated these brands are in London and other city centres, with Tossed and Abokado being almost entirely London-focused. Upper Crust, while more diversified between London and other cities mainly operates from travel hubs, and with passenger numbers down 95% at the height of lockdown in April it’s no surprise that it is taking decisive steps to rationalise its estate.
 Figure 4: Town profile splits for food to go brands which have done a CVA recently. (Source: Local Data Company)
In recent news, food-to-go brand Pret A Manger announced that it would launch a coffee subscription service which would allow coffee lovers unlimited hot and barista drinks for just £20 a month. The subscription model has increased in popularity and diversity with a growing range of TV, fashion, alcohol and meal box subscriptions available. Leon was also quick to follow in the footsteps of Pret, initiating its own coffee subscription service for just £15 a month in a bid to boost trade and secure revenue.
looking forward
Whilst it is still very early days in the fall out from lockdown, one must consider how long-term these trends are likely to be. Is the office as we know it really a thing of the past? While many enjoy the extra time and rebalancing between work and home life, it has led to some feeling disconnected and wondering whether long-term business culture will be eroded. The longevity of the working from home trend is key in understanding how transformative an effect it’ll have on our retail places.
What is clear is that the short-term impact of this pandemic has been significant and with recent advice taking a U-turn on whether staff should be travelling into offices we can expect more changes in the coming months.
Since the market was given the green light to reopen in June, we have already tracked many trends that have been accelerated, reversed and some which are brand new. In October we will be releasing our H1 openings and closures figures for the multiples market with our partner PwC, shortly followed by our full market analysis, available to download on the 4th November. This will provide the first quantified understanding of how the pandemic has changed the retail and leisure market thus far.
For more information on anything discussed in this blog, our planned data releases or our market report in November, please contact the LDC team at team@localdatacompany.com.

 901
901
901
901
 Figure 1: footfall trends for office and residential locations
 Figure 3 – Town profile split for top 20 food to go brands by size. (Source: Local Data Company)
 Figure 4: Town profile splits for food to go brands which have done a CVA recently. (Source: Local Data Company)